The Importance of Copyediting and Proofreading
February 27, 2024

Getting Started with Data Analytics in Power BI
Microsoft Power BI is a data analytics and visualization tool that was developed in 2015 on the back of Excel Add-ins such as Power Pivot, Power Query, and Power View. Not only does it appear to be a tool that is gearing up to replace SQL Server Report Services from Microsoft, it also seeks to compete directly with desktop visualization tools and reporting modules from third-party services. Power BI aims to give data owners the “Power” to access their data to drive business-making decisions through “Business Intelligence.”
Data Modeling
Power BI separates itself from similar tools by including powerful data modeling and transformation features. It is common practice to clean a dataset before importing it to reporting software. With Power BI, all the cleaning and transformation is done after connecting to a data source. Techniques that have traditionally required programming languages, such as R or Python for data manipulation, can be done within the tool without knowing any code. However, Power BI makes use of several programming languages for users who want to go beyond the options presented by the GUI. These languages are DAX, M, and R. DAX stands for Data Analysis Expressions and is the query language originally used in Power Pivot. It is similar to Excel formulas but contains more functions catered to relational data. M is the language behind every step in Power BI’s Query Editor and comes from Power Query in Excel. It is similar to F# and is used to build queries that mash up data. Lastly, R is a statistical analysis programming language that is a prominent part of a data scientist’s toolkit. Power BI can use an R script as a data source, to manipulate tables in the Query Editor, and to create visuals.
Analytics Pane
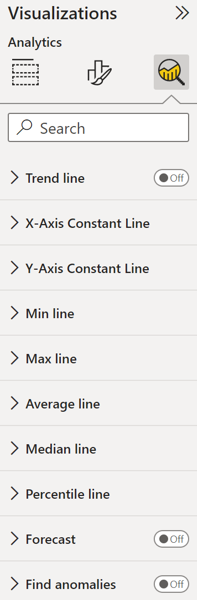
While the Query Editor and support for various data-related programming languages make Power BI a strong tool for data analysis, the tool includes even more analysis-related features. The analytics pane gives users the ability to add dynamic lines to visuals such as a constant, min, max, average, median, percentile, or forecast line. The lines available vary for each visual, but Microsoft plans to expand the functionality.
Parameters
Parameters are a way of adding a slicer to a page in your report that acts as a variable. For example, if the parameter is a percentage from 0 to 100 that represents sell-through, you can project how much revenue would be generated from any percentage using the slicer. Query Parameters are an entirely different variable that can be created inside the Query Editor and used for setting a variable when connecting to a data source. Parameters in either the reporting or data modeling side of Power BI are a great way to speed up the data cleaning process and improve functionality for the end user of the report. It is commonly stated that 70% of a data analyst’s time is spent cleaning data and only 30% is spent performing analysis. Power BI greatly decreases the time it takes to clean and model data.
Solution Templates
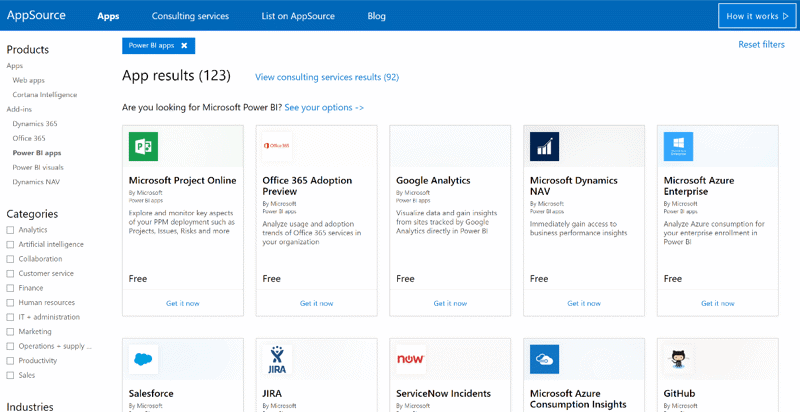
In addition to creating data connectors to directly connect to popular third-party data sources, Microsoft has added Power BI Apps, or Solution Templates, to their online store. These can be accessed from AppSource or by selecting Get Data from the Power BI Online Service. A solution template not only includes a connection to the particular data source, but also has pre-built visuals and a working data model all in one. In most cases, you simply need to sign in using the login credentials to the particular app and a report will be automatically created. While many of the solution templates are for paid services, there are plenty for common free applications as well.
Custom Visuals
Power BI also has a custom visuals section on AppSource where any developer can create and publish an open-source visual to be installed on Power BI Desktop. Microsoft ensures each visual is secure before adding, but it is important to read the terms for the visuals not created by Microsoft and create a governance around said visuals for your organization. The custom visuals can also be installed directly from Power BI Desktop and offer many great features not available in vanilla Power BI. Just like parameters, utilizing custom visuals saves time and increases the functionality of the tool.
Wrap Up
You may have heard of Power BI and are aware that it is a tool for building reports and dashboards. However, Power BI contains many unique data analytics features. Through the use of the powerful data modeling features, dynamic reference lines, report-level variables, free solution templates, free custom visuals, and more, you can go from basic pie charts and graphs to predictive modeling and actionable data insights.
Resources
DAX – DAX (Data Analysis Expressions) should be very familiar to users who have written Excel formulas. Here is an overview of how you can add new measures, columns, and tables to your data model based off existing datasets.
Power Query – Power Query allows you to edit data models and make complex data transformations through a user interface.
Sample Reports – Power BI has various sample reports and datasets to learn some best practices around data modeling and creating beautiful reports.
Custom Visuals – A library of additional visuals created by the Power BI community for even more report customization.

Brian KnoxCore Contributor
Business Analyst
Brian Knox has passed the DA-100: Analyzing Data with Microsoft Power BI exam and has been a Power BI developer, administrator, and instructor for over four years. He is a founder and leader of the Hampton Roads Power BI User Group. Brian applies his analytics knowledge as a business analyst at Marathon Consulting. He is a graduate from the College of William and Mary, having completed the inaugural class of the Master of Science in Business Analytics program. He has an undergraduate degree in Information Science from Christopher Newport University. Brian learned early on that he wanted to combine his passions of business and technology. Brian loves all things data and is always looking for ways to share his data science knowledge to help others throughout Hampton Roads.